Data Science Fundamentals — Hypothesis Testing
Mastering the Art of Hypothesis Testing in Data Science
I often like to think of data scientists as detectives.🕵️♀️ Kind of like Sherlock-Holmes or Nancy Drew type detective; searching for answers about questions we have about the world around us. These could be simple yes-no questions from a survey, or complex quantitative questions to answer a business problem.
Do the majorities of employees at company X prefer WFH over coming into work?
If you flip a coin 1000 times, what is the distribution of heads and tails flipped?
Is there a correlation between the number of hours of sleep a person gets and their reported level of productivity the following day?
In any case, these should be on a data scientists to-do list when hypothesis testing:
Come up with a hypothesis
Test your hypothesis
And then base your conclusions on certain methods
For example, empirical distributions or random samples.
First, it’s important to know, what is a model in data science?
Simply put, it is a set of assumptions about data. As a data scientist, we often need to determine whether or not a model is “good” or not. (I will go further into detail about model selection and model “goodness” in another article!)
For now, let’s assume we have a good model.
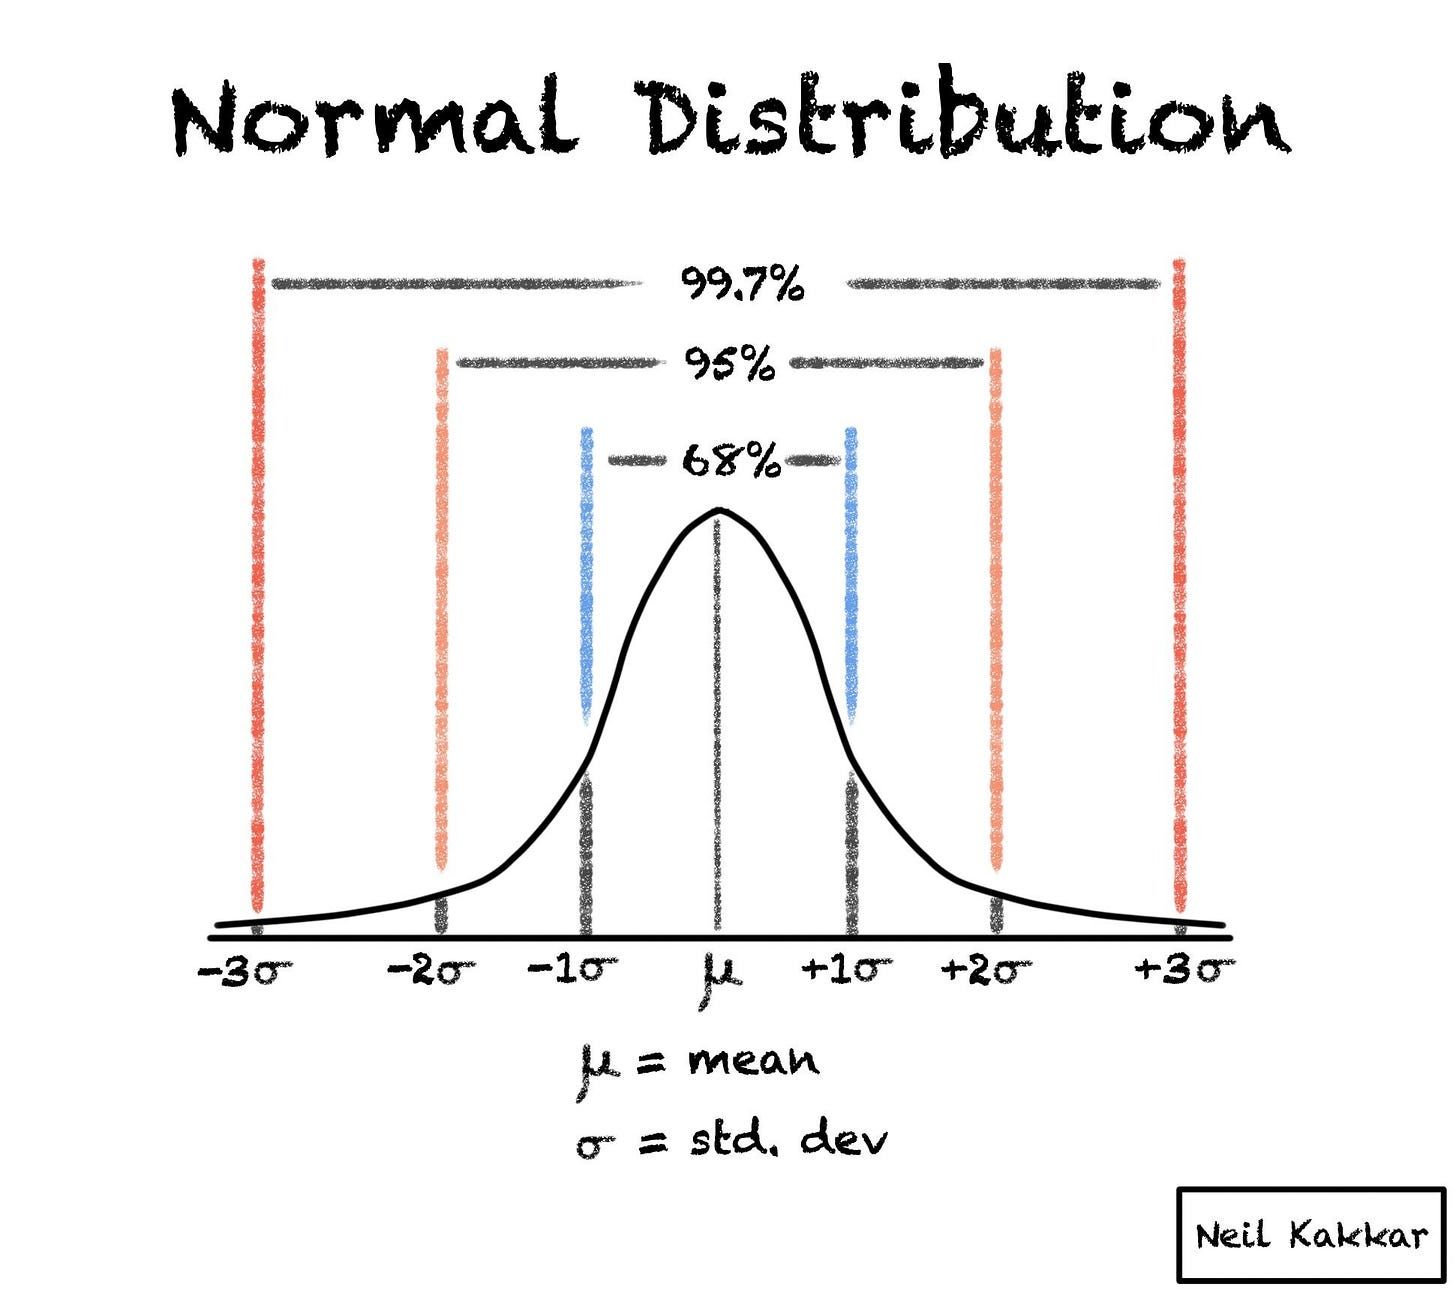
Let’s choose the data in our model to be the number of heads flipped by a coin in 1000 flips. We know that this is a normal distribution and there is a 50/50 chance of flipping a heads or tails if the coin is fair.
However, let’s say that out of 1000 flips, heads was flipped only 200 times (clearly not a normal dist). Our hypothesis could be: “the coin was fair & ended up with a small number of heads flipped due to chance”.
How would we test this hypothesis?
First, we should choose a statistic and then simulate that statistic under our model.
If you find this article helpful, consider subscribing & sharing! It helps support me so I can continue creating content like this👇
🧪Test Hypothesis
To test the hypothesis that the coin was fair and the small number of heads flipped was due to chance, one common statistic that can be chosen is the proportion of heads flipped in a given number of trials. In this case, you can calculate the proportion of heads flipped in the 1000 trials & then compare it to what we would expect if the coin were fair.
🎲Simulate the Statistic🎲
To simulate the statistic under our model, we can use a process called resampling. Resampling involves randomly selecting subsets of the original data and calculating the statistic of interest for each subset. By repeating this process many times, we can create a distribution of the statistic under the assumption that the coin is fair.
For example, we can randomly select 200 outcomes (representing the number of heads flipped) from the 1000 trials and calculate the proportion of heads in this subset. By repeating this process numerous times, we can obtain a distribution of proportions that would occur if the coin were fair. This distribution is called the null distribution.
👉Next, we compare the observed proportion of heads (200 out of 1000) to the null distribution. If the observed proportion is within the range of what would be expected under the null hypothesis, it suggests that the observed outcome is not significantly different from what we would expect due to chance alone.
On the other hand, if the observed proportion is extremely unlikely to occur under the null hypothesis, it provides evidence against the fairness of the coin.
🅿️-Value
To quantify the strength of evidence against the null hypothesis, we can calculate a p-value. The p-value represents the probability of observing a proportion as extreme as the observed one, assuming the null hypothesis is true. A small p-value suggests that the observed outcome is unlikely to occur due to chance alone and provides evidence in favor of an alternative hypothesis (in this case, that the coin is not fair).
🤖Explanation Through Code
import numpy as np

# Set parameters
num_flips = 1000  # Number of coin flips
num_heads_observed = 200  # Number of observed heads

# Simulate the statistic under the null hypothesis
num_simulations = 1000  # Number of simulations
null_proportions = []
for _ in range(num_simulations):
    # Generate a random sequence of 1000 coin flips (1 represents heads, 0 represents tails)
    coin_flips = np.random.choice([0, 1], num_flips)

    # Calculate the proportion of heads in the randomly generated sequence
    proportion_heads = np.mean(coin_flips)

    # Store the proportion in the null distribution
    null_proportions.append(proportion_heads)

# Calculate the p-value
p_value = np.sum(null_proportions <= num_heads_observed / num_flips) / num_simulations

# Print the results
print(f"Observed proportion of heads: {num_heads_observed / num_flips}")
print(f"Null distribution mean: {np.mean(null_proportions)}")
print(f"P-value: {p_value}")
What we are printing out above, is the observed proportion which is the mean of the null distribution, & the calculated p-value.
TL;DR😎
To test the hypothesis that the small number of heads flipped is due to chance, we can use resampling techniques to create a null distribution of proportions and compare the observed proportion to this distribution. The resulting p-value helps us assess the evidence against the null hypothesis and draw conclusions about the fairness of the coin.
Summary
Data scientists act as detectives, seeking answers to questions about the world through data analysis.
Hypotheses are formulated and tested in data science to answer various questions, ranging from simple yes-no questions to complex quantitative problems.
Testing hypotheses involves selecting a statistic and simulating it under a model to create a null distribution.
Resampling techniques, such as randomly selecting subsets of data, help create the null distribution and compare it to observed outcomes.
Comparing the observed proportion to the null distribution allows assessing the evidence against the null hypothesis.
Calculating a p-value quantifies the strength of evidence against the null hypothesis and helps draw conclusions about the fairness of the coin in this particular case.
That’s all for this week! Give me a shout if you have any feedback, stories, or insights to share with me. Other than that, I’ll see you next week!
Happy learning,
👋Ashley





Extravagant work Ashley Ha. The part that helped me the most was you learn better by doing rather that just memorizing stuff for a test.
Rick Eastman